
Swarnava Biswas1 and Moumita Mukherjee2
1PhD Research Scholar, Department of Physics, Adamas University, India
2Associate Professor, Department of Physics, Adamas University, India
nCOVID 19: About the disease
Human Corona virus was first perceived during the 1960s. Enormous variety of this virus is available in nature and in 2002 we witnessed the severity of Severe Acute Respiratory Syndrome CoV (SARSCoV) that executed from southern China and affected world population severely [1-3] . Later it tainted the Middle East areas as the Middle East Respiratory Syndrome CoV (MERS-CoV), that caused 919 people to die with an outstandingly high mortality rate of 35%[4]. In December 2019, it has returned in Wuhan, China, in mutated form of Novel Corona Virus and has spread over 199 countries and affected more than three million of world population till date with killing more than 3 lakhs of people (Source: World Health Organization 2020) until this point of time. World Health Organization has declared this as ‘pandemic’ by the middle of March 2020. In absence of any antiviral treatments for nCOVID-19, the most important strategy to reduce the affected number of population (and in turn mortality) is by introducing classical lockdown mechanism. According to that health prescription, the major portion of world is now eventually locked down due to the outbreak of nCOVID-19.
The Basics of Mathematical Modelling:
The fast and relentless spread nCOVID-19 has segmented the populace into four classes, such as susceptible, exposed, infected and recovered. Adapting the classical SEIR- type epidemic model, using differential equations, appropriate boundary conditions, the direct person-to-person contact transmission is taken as the direct route of transmission of nCOVID-19 pandemic. The authors have developed a generalised self-consistent statistical model through Python and R- Programming language by adopting several real nodes of societal impacts for contaminations. The authors initially determined the parameters of the model from the accessible day to day information for Indian states from initial 35 days history of diseases, recuperations and deaths. The determined parameters have been amassed to extend future patterns for the Indian subcontinent, where we are still at the beginning of the contamination cycle peak.
Susceptible- Exposed- Infectious- Recovered (SEIR) – type epidemiological models for the modelling of the Infectious disease studies was first proposed by Kermack– McKendrick in 1927. Infectious diseases are caused when certain types of parasites invade into a host. In SEIR models, people in a population are partitioned into susceptible (?), exposed/latent (?), infectious (?) and recovered/removed (?) individuals, and the models are alluded to on the premise of the contamination’s statuses of included people. Susceptible people can be defined as the individuals who have a probability to get infected. Exposed people are those, who are not infectious, but they have been exposed to the disease and at the same time they are infected. Infectious people can spread the infection. Recovered people are those, who have recovered from the infection. The evaluation and propagation of nCOVID-19 infections in India can also be modelled and predicted with the help of said SEIR model.
What factors influence the spreading of pandemic?
The main parameters which are used to simulate the situation are as follows:
Growth rate, which is defined as the number of rise-in infections of nCOVID-19 in India due to the interactions between the susceptible and infected populations. It depends on various factors such as population, reproduction number of nCOVID-19, mobility, precautionary measures etc. Recovery rate is defined as, the rate at which the infected persons get recovered. Contact rates are defined as the number of susceptible people, an infectious person contact. Among 7,290 individuals in eight European nations, the normal contacts per individual was 13.4 with a nation scope of 7.95 (Germany) to 19.77 (Italy). Young people had the most noteworthy contact rate (18) contrasted with adults 20-60 (13), and olds 60+ (8) [5-6].For the case of India, we have assumed an initial contact rate of 12 to optimize the model. But gradually when the nation-wide lock-down is imposed from 24th March 2020 and declared to be continued up to the 1st week of May 2020, then the authors modified the contact rate in the model and decreases it by 60%. Transmissibility is defined as the probability that a contact between a susceptible person and an infected person results in infection. The value used, 1.7%, was estimated by comparing the Reproduction Number (R0) in community settings (1.4 to 3.9) with a normal contact rate and a cruise ship (14.8) which has a high contact rate. R0 varies with contact rate whereas transmissibility and removal rate (inverse of duration of infectiousness) were kept constant [7-8]. Reproduction Number (R0) is defined as the number of secondary cases resulting from one case. Mathematically it can be obtained as the product of Contact Rate, Transmissibility and Removal Rate. Estimates for nCOVID-19 have been between 1.4 to 3.9. The inverse of R0, (1-(1/R0)) is the proportion of the population who need to be infected (or vaccinated) for transmission to no longer be self-sustaining. R0 is also an indication of the effectiveness of community interventions. An R0 less than 1 indicates transmission has stopped [9].The authors have found that from 10 early cases in China showed the mean serial interval (time between successive cases) was 7.5 days with a Standard Deviation (SD) of 3.4 days. A more recent estimate among 468 cases was 3.96 days with a 4.75-day SD[10].But in the current context of India, the authors noticed that, a patient is taking minimum 14 days to get recovered. So, for this case of nCOVID-19 modelling in India, the authors have taken duration of Infection as 14 days. Various errors such as square integral error, terminal error and terminal rate error between the actual data and predicted data are minimized by optimizing different set-parameters.
What is the predicted scenario for India from our study?
After 15th March, 2020, nCOVID-19 infection in India started to show an exponential trend. The SEIR model has been simulated and all the parameters have been optimised based on infection trends obtained for India for nearly 50 days (up to 20th of May 2020). The differential equations have been solved by using Python and R- Programming languages. The forecasted data are showed graphically in Figure 1.
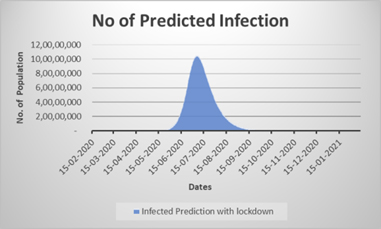
Figure 1: The prediction of COVID-19 pandemic in India with withdrawal of lock-down (in absence of test kit for asymptomatic population, migrated labour influence and considering full withdrawal of lockdown order (if full normalization is implemented by opening / running everything at its full strength)
Due to the unavailability of test kits and consequently lack of testing of all asymptomatic individuals in India, during this lockdown period,, migrated labour influence, withdrawal of lockdown and opening of public and private sectors to its full pace, the simulated peak may rise to as high as 10 Crore of total population by middle of July , after the lockdown is withdrawn on 17th May. The effect of lockdown is clearly reflected in the flattening of curve, i.e. the peak will reach to 10 Crore within the time interval of 120 days after lock down get withdrawn on 17th May, 2020. From Figure 2, the number of forecasted infected patients is significantly correlating with actual number of infected patients, till date, with a correlation coefficient of 0.99. Here the validity and novelty of the model is established. So, this model can be used to predict the future scenario of nCOVID-19 in India, under various adopted conditions. The authors outlined how these effects may shift, under various transmission and mediation situations.
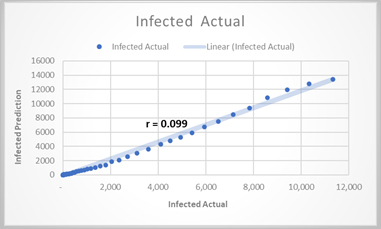
Figure 2. Correlation of simulation result with actual scenario ( as on 14.5.2020)
If the nation-wide lock down was not enforced from 24th March 2020, then as per the model, the contact rates of the susceptible individuals with the infected individuals would get altered. In that case the probable situation of India is forecasted in Figure 3, which is a comparison between forecasted Indian situation in lock-down (without kit test for all asymptomatic individual in India) and without lockdown scenario.
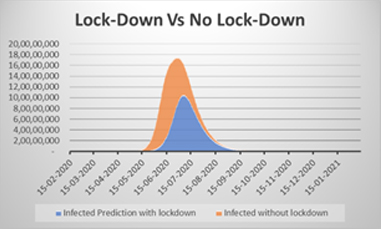
Figure 3. Comparison of (a) lock-down (in absence of test kit for asymptomatic population) and (b) no lockdown condition (s)
But the alarming fact is that, depending upon the future predictions through this model, India would be in a great danger zone, if we fail to provide test kit for all asymptomatic population in India, right now. Current Mortality rate till date in India is ~ 3%. If even this mortality rate persists then also a dangerous situation in India may arrive by mid of July, as predicted from the model. As the development pace of COVID-19 contaminations ascended on 21st March 2020, the Prime Minister of India Shri. Narendra Modi announced a supposed one-day lockdown on 22nd March 2020 in name ‘Janata Curfew’ which brought down the development pace of cases from 3.69 to 1(MOHFW, India). Being a nation of 100 million individuals the viability of conferring lockdown is a significant obstacle to the Government. A minor level of individuals despite everything act slack and careless about the lockdown have become super-spreaders of their locale. Indeed, even 0.1% of oblivious individuals of the nation are an immense populace that can spread the pandemic vivaciously.
Model suggests:
So, to control this situation, the authors are suggesting some points through the developed generalized SEIR model:
- The main parameter which affects the total number of infected individuals is the contact rate. If a normal patient, by any chance goes near the vicinity of a nCOVID-19 patient without any preventive measure, then the probability of getting infected of a susceptible person increase rapidly. So, to overcome this situation, the contact rate should be taken care.
- If the contact rate can be maintained within a range of 5, then the chance to control of this pandemic situation get increased. So social distancing and isolation of infected individual is the only way out to get rid of the pandemic.
- The transmissibly is another major factor, which can control the situation. If the nation can maintain the probability of a susceptible people to get infected, below 10%, then it will help to overcome the pandemic in the context of India.
Such measures could reduce the peak prevalence substantially, thus minimizing the pressure on public health services. The total numbers of nCOVID-19 cases are also decreasing day by day and the reproduction number (R0) reaches below 1. Therefore, the lock-down has the effect of ‘flattening’ the epidemic curve, distributing cases over a longer duration than in the absence of lock-down. The more intervention with testing for all asymptomatic population could reduce the cumulative incidence by nearly 60 per cent.
References:
- Drosten C, Günther S, Preiser W, Van Der Werf S, Brodt HR, Becker S, Rabenau H, Panning M, Kolesnikova L, Fouchier RA, Berger A. Identification of a novel
coronavirus in patients with severe acute respiratory syndrome. New England journal of medicine. 2003 May 15;348(20):1967-76. - Ksiazek TG, Erdman D, Goldsmith CS, Zaki SR, Peret T, Emery S, Tong S, Urbani C, Comer JA, Lim W, Rollin PE. A novel coronavirus associated with severe acute
respiratory syndrome. New England journal of medicine. 2003 May 15;348(20):1953- - Peiris JS, Lai ST, Poon LL, Guan Y, Yam LY, Lim W, Nicholls J, Yee WK, Yan WW, Cheung MT, Cheng VC. Coronavirus as a possible cause of severe acute respiratory syndrome. The Lancet. 2003 Apr 19;361(9366):1319-25.
- Zaki AM, Van Boheemen S, Bestebroer TM, Osterhaus AD, Fouchier RA. Isolation of a novel coronavirus from a man with pneumonia in Saudi Arabia. New England Journal of Medicine. 2012 Nov 8;367(19):1814-20.
- Mossong J, Hens N, Jit M, Beutels P, Auranen K, Mikolajczyk R, Massari M, Salmaso S, Tomba GS, Wallinga J, Heijne J. Social contacts and mixing patterns relevant to the spread of infectious diseases. PLoS medicine. 2008 Mar;5(3).
- Bootsma MC, Ferguson NM. Public health interventions and epidemic intensity during the 1918 influenza pandemic. Proc. Natl Acad. Sci. USA. 2007;104:7588-93.
- Rocklöv J, Sjödin H, Wilder-Smith A. COVID-19 outbreak on the Diamond Princess cruise ship: estimating the epidemic potential and effectiveness of public health countermeasures. Journal of travel medicine. 2020.
- Riley P, Ben-Nun M, Armenta R, Linker JA, Eick AA, Sanchez JL, George D, Bacon DP, Riley S. Multiple estimates of transmissibility for the 2009 influenza pandemic based on influenza-like-illness data from small US military populations. PLoS computational biology. 2013 May;9(5).
- Novel CP. The epidemiological characteristics of an outbreak of 2019 novel
coronavirus diseases (COVID-19) in China. 2020 Feb 17;41(2):145 - Thompson R. Pandemic potential of 2019-nCoV. The Lancet Infectious Diseases. 2020 Mar 1;20(3):280.
Visited 2527 times, 1 Visit today